|
Begin Main Content
Junye Chen, Anthony D. Del Genio, Barbara E. Carlson, and Michael G. Bosilovich
The dominant interannual El Niño-Southern Oscillation phenomenon (ENSO) and the short length of climate observation records make it difficult to study long-term climate variations in the spatiotemporal domain. Based on the fact that the ENSO signal spreads to remote regions and induces delayed climate variation through atmospheric teleconnections, we develop an ENSO-removal method through which the ENSO signal can be approximately removed at the grid box level from the spatiotemporal field of a climate parameter. After this signal is removed, long-term climate variations, namely, the global warming trend (GW) and the Pacific pan-decadal variability (PDV), are isolated at middle and low latitudes in the climate parameter fields from observed and reanalyses datasets.
Except for known GW characteristics, the warming that occurs in the Pacific basin (approximately 0.4K in the 20th century) is much weaker than in surrounding regions and the other two ocean basins (approximately 0.8K) (Figure 1). The modest warming in the Pacific basin is likely due to its dynamic nature on the interannual and decadal time scales and/or the leakage of upper ocean water through the Indonesian Throughflow. Based on NCEP/NCAR and ERA-40 reanalyses, a comprehensive atmospheric structure associated with GW is given. Significant discrepancies exist between the two datasets, especially in the tightly coupled dynamic and water vapor fields. The dynamic field based on NCEP/NCAR reanalysis, which shows a change in the Walker Circulation, is consistent with the GW change in the surface temperature field. However, intensification in the Hadley Circulation is associated with GW trend in the ERA-40 reanalysis.
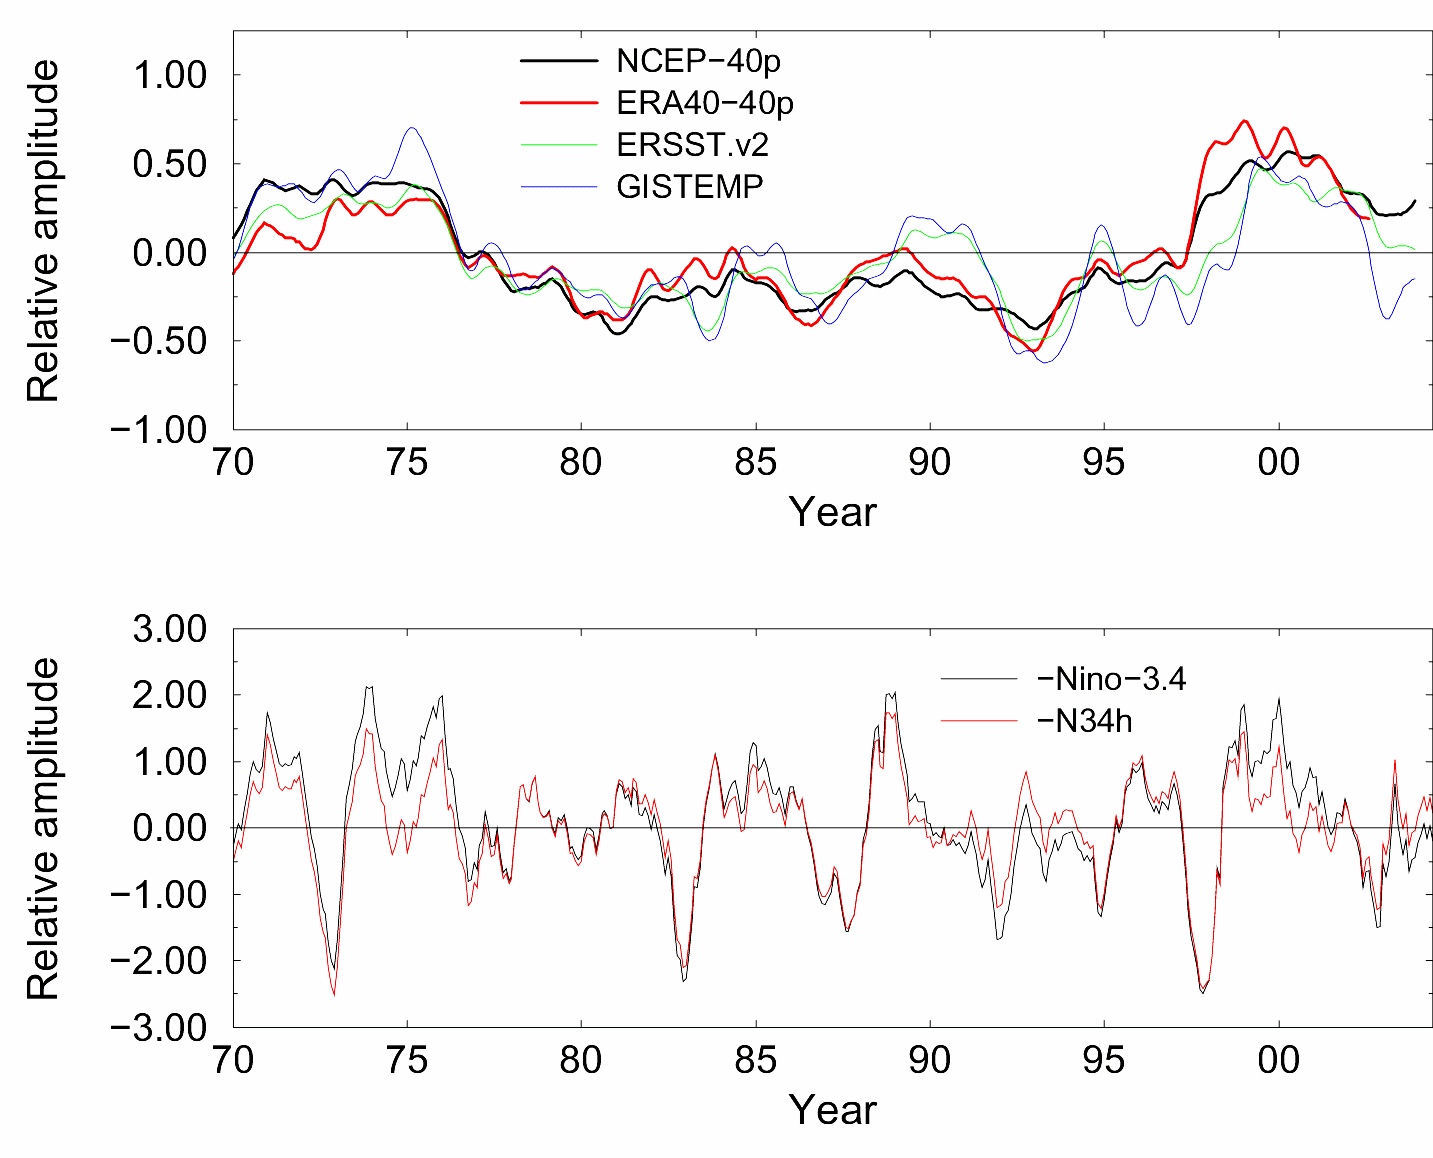
In this study, we show that one of several PDV interdecadal regime shifts occurred during the 1990s (Figure 2). This significant change in the Pacific basin is comparable to but opposite in phase to the well-known 1976 climate regime shift, and is consistent with the observed changes in ocean biosphere and ocean circulation. A comprehensive picture of PDV as manifested in the troposphere and at the surface is described. In general, the PDV spatial patterns in different parameter fields share some similarities with the patterns associated with ENSO, but important differences exist. First, the PDV circulation pattern is shifted westward by about 20 degrees and its zonal extent is restricted compared to that for ENSO. The westward shift of the PDV wave train produces a different, more west-east oriented, North American teleconnection pattern. The lack of a strong PDV surface temperature (ST) signal in the west equatorial Pacific and the relatively strong ST signal in the subtropical regions are consistent with an atmospheric overturning circulation response that differs from the one associated with ENSO. Our analysis also suggests that PDV is a combination of decadal and/or interdecadal oscillations interacting through teleconnections.
 |
Figure 1. The spatial patterns of the trend (first) modes of the 1900-2003 ENSO-removed EOF analyses based on GISTEMP and ERSST.V2. This mode explains 27.8% and 31.1% of the total variance in the ENSO-removed annually smoothed anomaly data of GISTEMP and ERSST.V2, respectively. Each grid of the spatial patterns is scaled to represent the warming of the local temperature from 1900 to 2003 |
|
 |
Figure 2. Upper plot: The time series of the PDV mode based on NCEP/NCAR (black, 9.6% variance explained), ERA-40 (red, 9.1% variance explained), ERSST.V2 (green) and GISTEMP (blue). Lower plot: The negative Niño-3.4 index (black) and its 6-yr high pass time series (red) based on ERSST.V2. |
Reference
Chen J., A. D. Del Genio, B. E. Carlson, M. G. Bosilovich, 2007: The spatiotemporal structure of 20th century climate variations in observations and reanalyses. Part I: long-term trend. J. Clim. (submitted).
Chen J., A. D. Del Genio, B. E. Carlson, M. G. Bosilovich, 2007: The spatiotemporal structure of 20th century climate variations in observations and reanalyses. Part II: Pacific pan-decadal variability. J. Clim. (submitted).
|